Aweek ago, as part of an academia-ministry of health brainstorming, I suggested to Prof. Roy Kishony, my former advisor, the idea of pooling COVID-19 samples together as a way of making the tests more efficient and thus being able to test more people. Back then, it was a very preliminary thought, half-baked.
But since then, the team in the lab of Prof. Roy Kishony managed to coordinate with overwhelming speed and efficiency an experiment that shows that in fact the LOD (limit of detection) of the currently used COVID-19 test allows for 1:32 and even 1:64 dilution! This means that we can mix a single positive sample of COVID-19 with 31 or 63 negative samples respectively, and still manage to detect the virus. This amazing result was posted on Twitter and latter in medRxiv.
As demonstrated in South Korea, the country which so far seems to be the most successful in slowing down infection rate, mass testing for infected individuals helps. However, mass testing is impractical for most countries, since a country with N individuals would require N tests. Can pooling help?
Together with Maor Ivgi, I set out to show that this is in fact actionable.
The goal of this short post is to present the motivation behind the sample pooling method. Or in other words — how can we utilize the ability to detect COVID-19 in pooled samples to identify infected individuals with much fewer tests.
Important disclaimer: we are neither epidemiologists nor we are laboratory workers so we don’t claim to understand or predict the course of the epidemic nor the best lab practice. We are simply adding some mathematical background that can help improve testing efficiency.
This post will be divided into 2 sections:
a. Explanation and basic math to show our pooling strategy.
b. Additional improvements to the method that can further increase efficiency.
All the code for the calculations can be found here.
Explanation and math of the pooling strategy
Even if you are not a mathematician, this section should be clear enough for you. I’ve tried to incorporate some basic math into a coherent explanation of the technique.
Let’s first define some basics:
Problem to solve: given N samples collected from individuals that are suspected to be infected by the COVID-19 virus, labs currently have to conduct N tests in order to identify all the positive samples. Given a limited amount of laboratories and equipment this is not efficient and we would like to try and decrease it.
Pooling: mixing s samples from different people together and conducting the test on the mixed sample
Probability of infection: p, the estimated probability of an individual in the population to be infected, assuming that infections are independent across the population.
Claim: given a number of samples of |s|=N>1, for certain values of p, we can, in expectancy, to identify all positive samples in less than N tests.
This will be done using a ‘divide and conquer’ approach within each pool.
Put in simple words: for probabilities of infection of individuals inside the population that are smaller than some threshold, we can find all the positive samples inside a group with perfect precision* without the need to test all of them. The optimal size of the pooled group depends on the probability of infection. The way to do it will be to rule out the entire group if it returns negative, and otherwise divide the group into two subgroups half the size each and test both of them. This will be done recursively.
An example for a random case is shown in the drawing below:
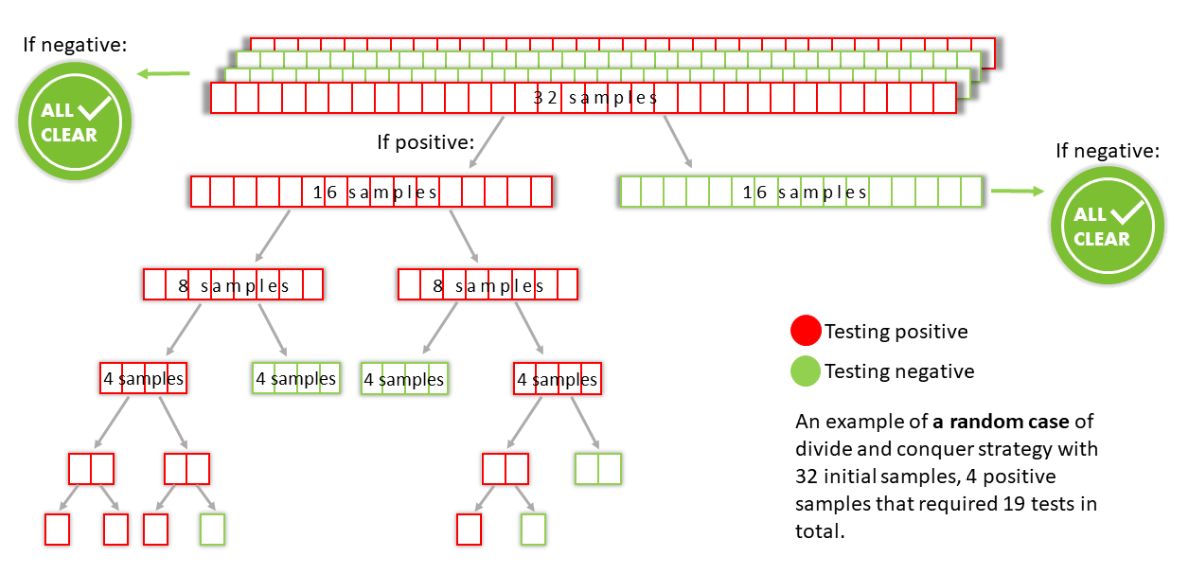
* up to a test error caused by the test itself.
Some math…
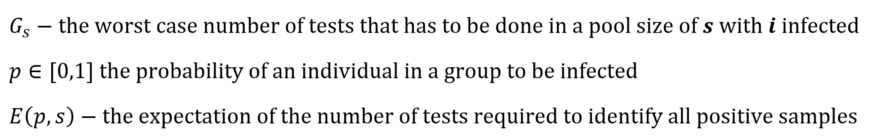
The use of these equations is demonstrated in the algorithm in the attached code.
Note: we are solving this problem for the worst possible case of Gs. Intuitively, this means that our positive samples are ordered in such a way inside each subgroup, that when dividing it into two, the positives will split between the groups rather than going into the same group.
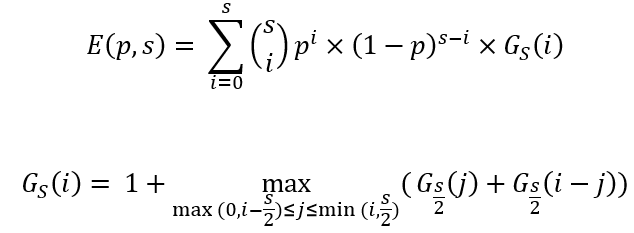
In addition, we added a “test_all” bar that represents a strategy in which all individual samples within every positive pool of size 32 will be tested. Meaning, pooling will be done in pool sizes of 32, but “divide and conquer” strategy will not be utilized. The equation for the expectation for such strategy is:

Calculating E(p,s) for multiple pool sizes (s) and for different probabilities of infection in the population (p) we get the following plot:
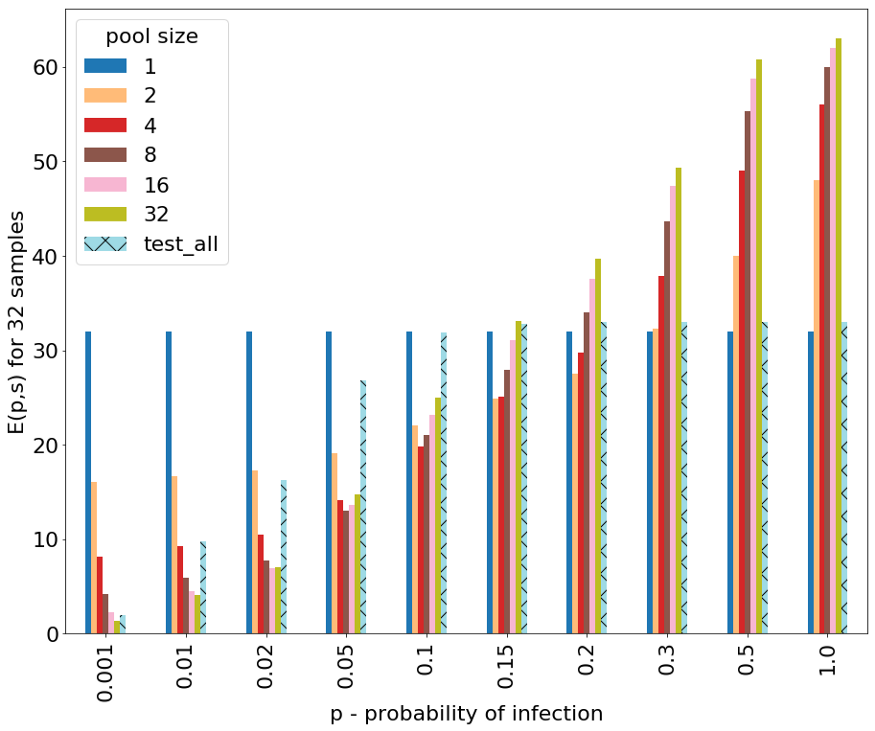
The x-axis is the probability of infection p. This is something that has to be determined by the epidemiologists and obviously is dynamic over time and between different groups depending on some risk factors.
The y-axis is the expectation value of the number of tests that are needed to be performed in order to identify all positive samples in the worst case. Note that these expectation values are normalized for groups of size 32.
The different bars represent the use of differently sized pools. Pool size of 1 represents the naïve approach of not pooling, which is the current approach.
We can see that for probabilities of infection that are low, in particular less than 0.01 (1% of population), the lowest expectation value is achieved using pool size of 32. Next, for probabilities of infection that are between 0.02–0.3 (2%-30%) different sizes of pools (2–16) give the best (lowest) expectation value. Finally, for probabilities of infection that are greater than 0.3 (30%) the best (lowest) expectation value is achieved by not pooling at all (simply testing all samples individually). Notably, using the “test all individual samples within each positive pool” strategy (“test_all”) has a relatively low expectation value when p is very small (<0.01), though not better than our proposed strategy with pool size of 32. But in higher values of p, the expectation for this strategy rises fast, making it inefficient. This is a worst case analysis, but in the average case the results of the expected number of tests in a random ordering of each of the pooled techniques will be better, while the naïve approach remains on a constant 32 tests for 32 people. The average case calculation and plot are shown in the attached code.
This means that in fact, assuming that we can estimate the probabilities of infection in the tested population we can optimize the pool size and potentially conduct less than N tests.
Further improving the strategy
Now that I have presented the basic idea, I would like to discuss two optional upgrades that can be added and make efficiency even better.
- Pre-scoring and ordering the samples. While in the previous section we referred to p (probabilities of infection) being the same for the entire population, in reality it is not. There is heterogeneity in the population, as was beautifully demonstrated and utilized in McMahan et al.. So, if we manage to score the samples prior to testing based on their risk of infection, we can then order them by their scoring, resulting in less positive pools, meaning less tests conducted. Again, without claiming to be epidemiologists or health care professionals, some possible suggestions for the scoring method could be: verified close contact with a known patient, second-order contact, presence of symptoms, etc.
- The usage of blocks. Perhaps at some stage or the presence of some considerations there won’t be a need to identify each individual positive sample, but rather it might also be helpful to identify some very close contact blocks. As an example, for family members that live in the same household, it will be enough to identify whether at least one family member is infected and act upon it. In this case, the use of blocks that are moving together in the division will allow for early stopping of the algorithm (once a node is positive and consists only of the given block there is no need to continue splitting and testing).
To summarize,
The pooling strategy that we’ve described here could become extremely useful if a country moves to comprehensive, nation-wide testing of their population, as South Korea did. This is because the current (up. 24.3.2020) reported probabilities of infection (1, 2, 3)* are : 2.5% in South Korea, 8.9% in the UK and 7.6% in Israel. This is calculated by dividing the number of positive tests in the total number of tests. While in South Korea, thanks to the wide spread testing, the probability of infection is most likely representative of the total population, in Israel this value could give an upper bound since the tests are performed mainly to individuals with higher risk of infection, and increasing the number of test outside of this circle will most likely decrease the probability of infection.
We have presented a strategy for the pooling test that is backed by math, to reduce the number of tests needed to identify positive samples. The strategy relies on the knowledge or good estimation of the probability of infection within the population or at least the tested sub-population. It also doesn’t take into consideration any practical or logistical limits of the laboratory workers. However, with some adjustments we believe it can be made simpler to implement.
*Total number of tests and positive samples in South Korea, UK and Israel (unofficial):